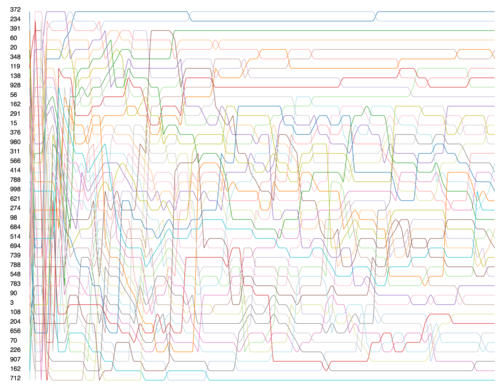
With the new ranking system comes a bunch of questions, Scott did a great job looking at real data but I also wanted to show you guys how ranks can be expected to change as matches play out. As well as provide a tool for answering questions like: “I have 24 teams at my off season, how many matches should I run to get a reasonable ranking” (The answer, by the way, is as many as you can get away with).
Before I get to that though, let’s talk a bit about methodology: I generate the team numbers as random numbers between 1 and 1000 and assign them a “skill” this skill is basically a representation of how good they are at playing the game. After that, I pull a template schedule (special thanks to Cheesy Arena for generating schedules), populate it with teams, and run the matches. Running matches is a simple matter of taking the sum of the teams’ skill attributes and multiplying them by some arbitrary match score number. The match score number is simply a random number chosen to make the match scores look nice. Because it’s constant it really doesn’t matter what number it is, but the scores looked “realistic” to me so I ran with it. Then it was a simple matter of computing average scores for each team after every match and plotting them. It’s not the cleanest code (I tossed together the entire thing in a couple hours) but it’s hosted on github at https://github.com/schreiaj/2015_ranking_sim I’m hoping to have a README up on how to run it locally before this post goes live.
So, thanks for sticking with me, let’s take a look at a simulation of a district event shall we? On the left, teams are sorted according to expected outcome (best to worst), each line represents the team’s rank as matches are played, any matches, not just ones the team played in.

Well, that’s a big mess isn’t it? Let’s see if we can make some sense of it, I’ve highlighted the ranking changes of the best team at this event below.

Being the best team, you’d expect them to rank first? Good news, in most of the simulations they do. You can see that they dropped to #26 early, but recovered after a few more matches were played. Their mean rank through the event was #2, but they finished where they were expected to.
I’ve run through a lot of these simulations, and the good news is that the new system seems to closely correlate rank and skill better than the WLT system. Though schedule does still come into play a little it’s not going to take a 1st place team and drop them to 20th like the old system could.
Limitations on the simulation?
Well, I assume that no team is worth negative points, the worst they can be is sitting in a corner contributing nothing. I’m not sure if that’s a valid assumption, and it’s a rather simple change to make so there may be further experimentation with it.
I also assumed team skill distribution was an exponential distribution with a lambda of 1.5. Why this? Because I picked a number that felt right after looking at the team skills. Why not a normal distribution? Look at teams at the next event you’re at, should be self explanatory.
Ok, without more of me getting in the way, here’s the tool. http://schreiaj.github.io/2015_ranking_sim/?teams=40&matches=12
By changing the teams and matches arguments you can simulate larger or smaller events. Just remember, teams maxes out at 100, and matches at about 14.
Content/Analysis Provided By: Andrew Schreiber (Mentor FRC125)
[…] FRC [EC] Suffield Shakedown 2015 [EA] 2015 Robot Archetypes [HL] Strategy Review: Lap Bots (2008) [SA] 2015 Ranking: Visualization [SA] 2015 Ranking: QA vs. QS [RP] Ultimate Utility – FRC67 (2012) [PP] Coach’s Corner […]